Team & Board Analytics PRO
See how much work there is, how fast it moves and who is carrying it.
The Pro analytics area provides reporting around task volume and completion. It includes board selection and date-range controls, and calculates completion and overdue information for the analytics views. Open it from Kanbanz → Analytics.
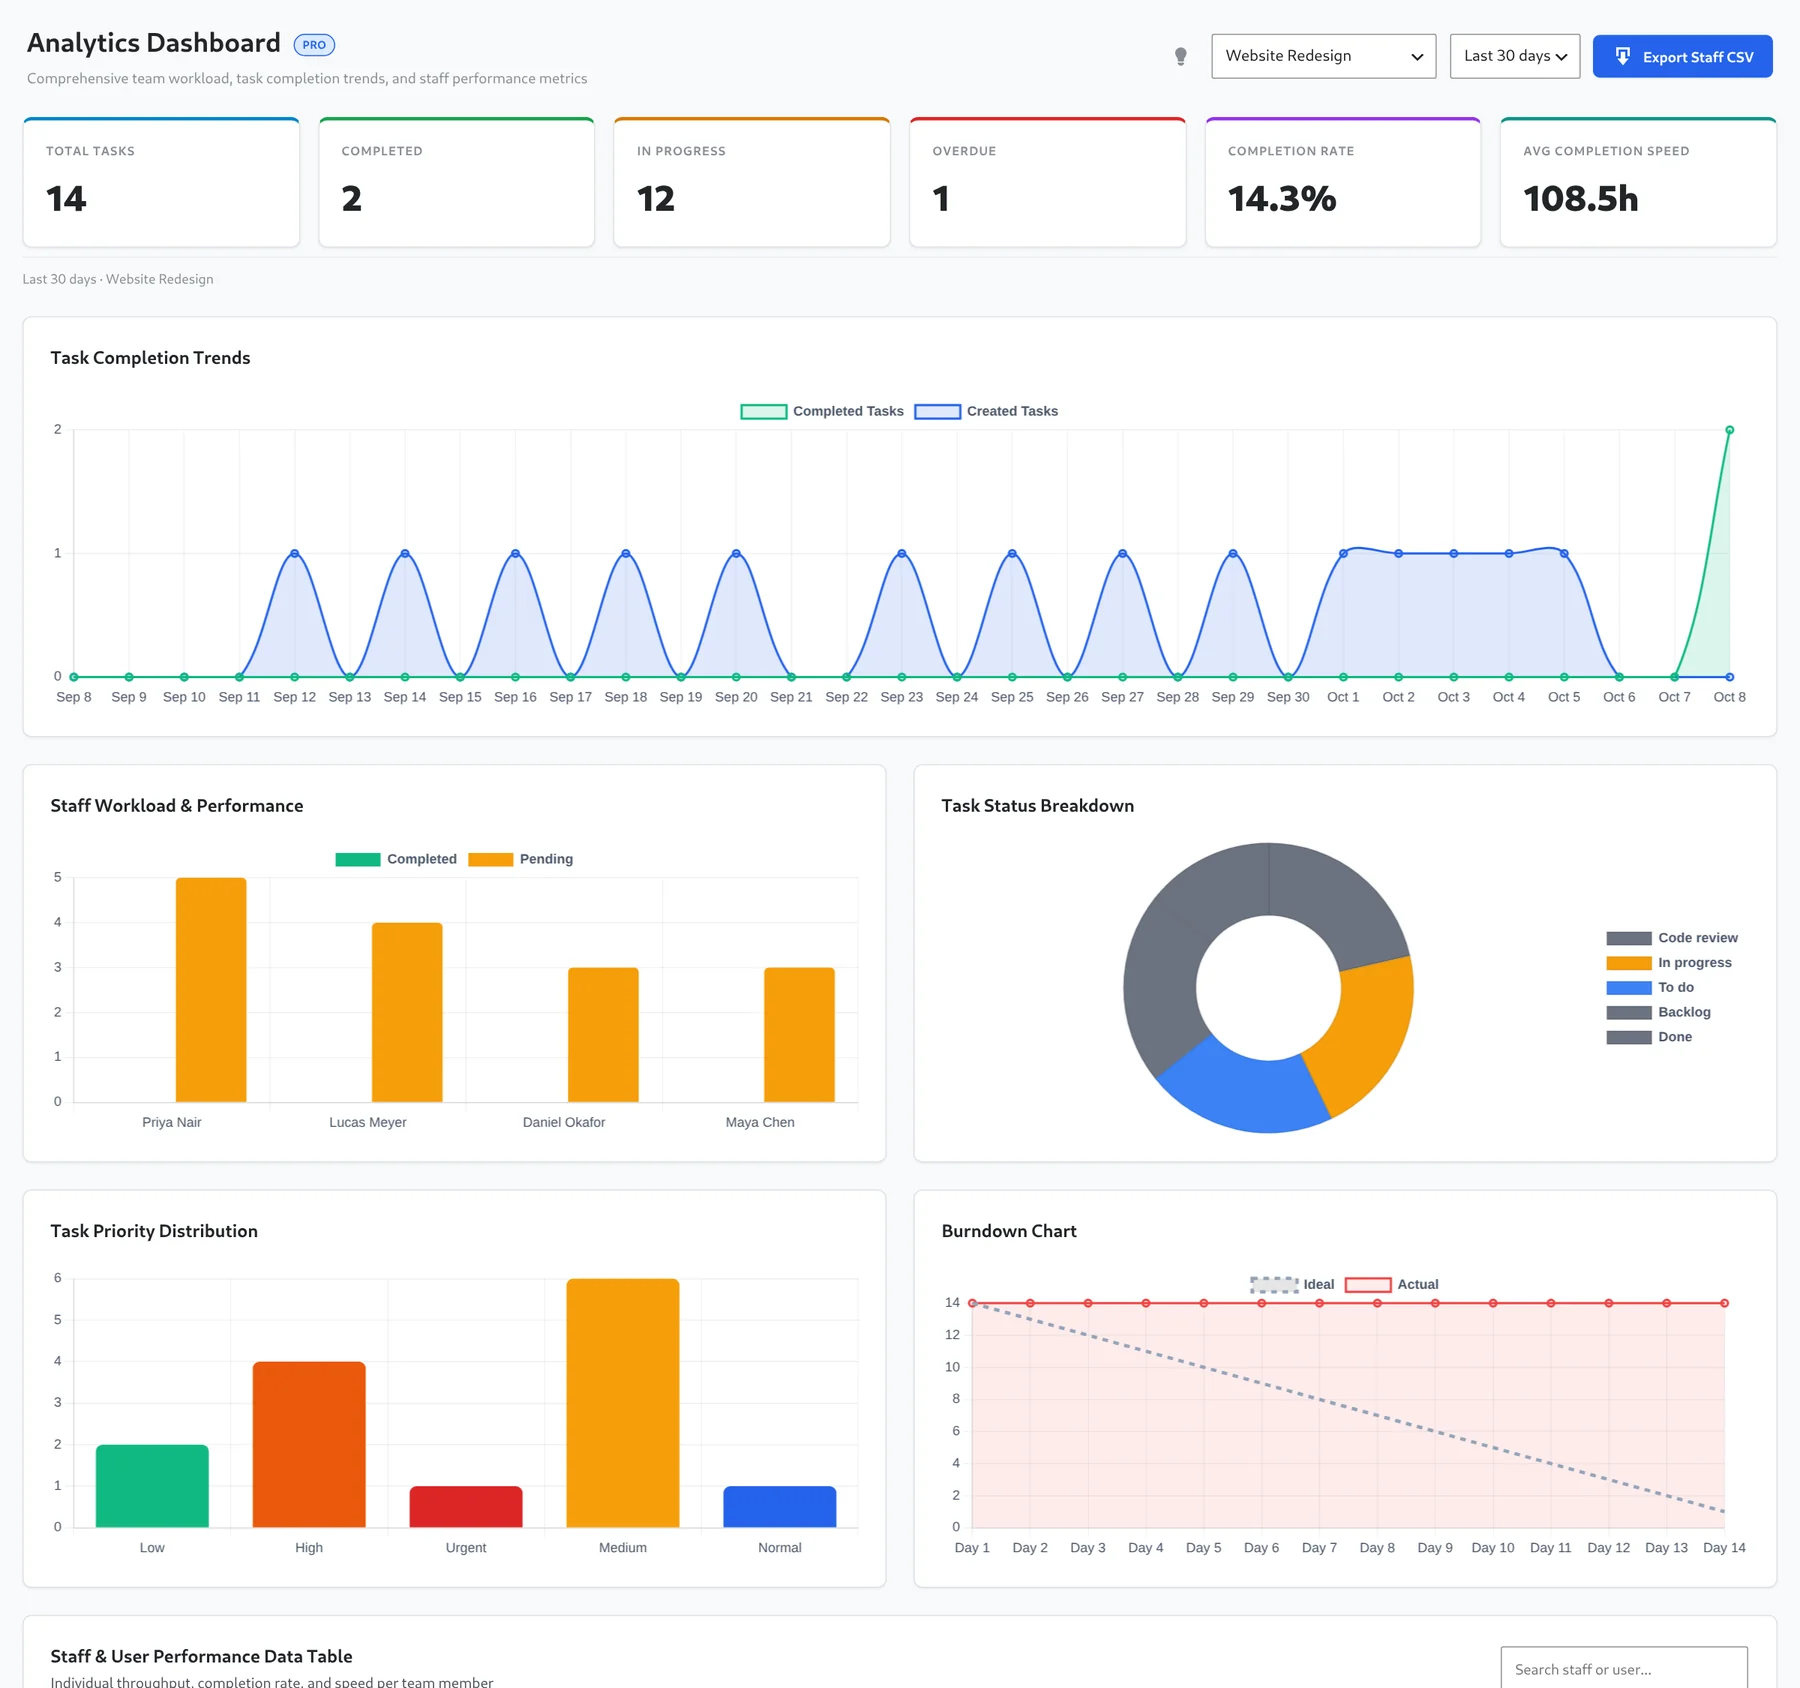
Controls
- Board: All Boards or one board.
- Date range: last 7, 14, 30 or 90 days.
- Export Staff CSV: see Exports & Reports.
Summary cards
| Card | Meaning |
|---|---|
| Total Tasks | Tasks in scope. |
| Completed | Tasks in the board's last column. |
| In Progress | Every task that is not yet completed, including tasks still waiting in early stages. |
| Overdue | Open tasks past their due date. |
| Completion Rate | Completed tasks as a percentage of total. |
| Avg Completion Speed | Average hours it takes to complete a task. |
Charts
- Task Completion Trends: tasks created versus completed over time.
- Staff Workload & Performance: completed and pending tasks per person.
- Task Status Breakdown: how tasks are spread across stages.
- Task Priority Distribution: how many tasks have each priority.
- Burndown Chart: ideal versus actual remaining tasks across a 14-day window. Select a specific board to see it.
- Staff & User Performance Data Table: a searchable, sortable table of throughput, completion rate and speed per person.
Reading the numbers
- A flat Actual line on the burndown means nothing is reaching the last column. Check your WIP limits and stages.
- A tall Pending bar for one person points to workload imbalance.
- Rising overdue plus falling completions is the signal to revisit due dates, or SLA rules.