Employee Performance PRO
Scorecards for each person: workload, speed, time and overdue work. The screen appears as Kanbanz → Staff Performance.
The Employee Performance area provides staff-level performance reporting. It has date inputs and board filters, and calculates task and completion information for staff performance views.
Use case: managers can review workload and completion patterns rather than relying only on individual task lists.
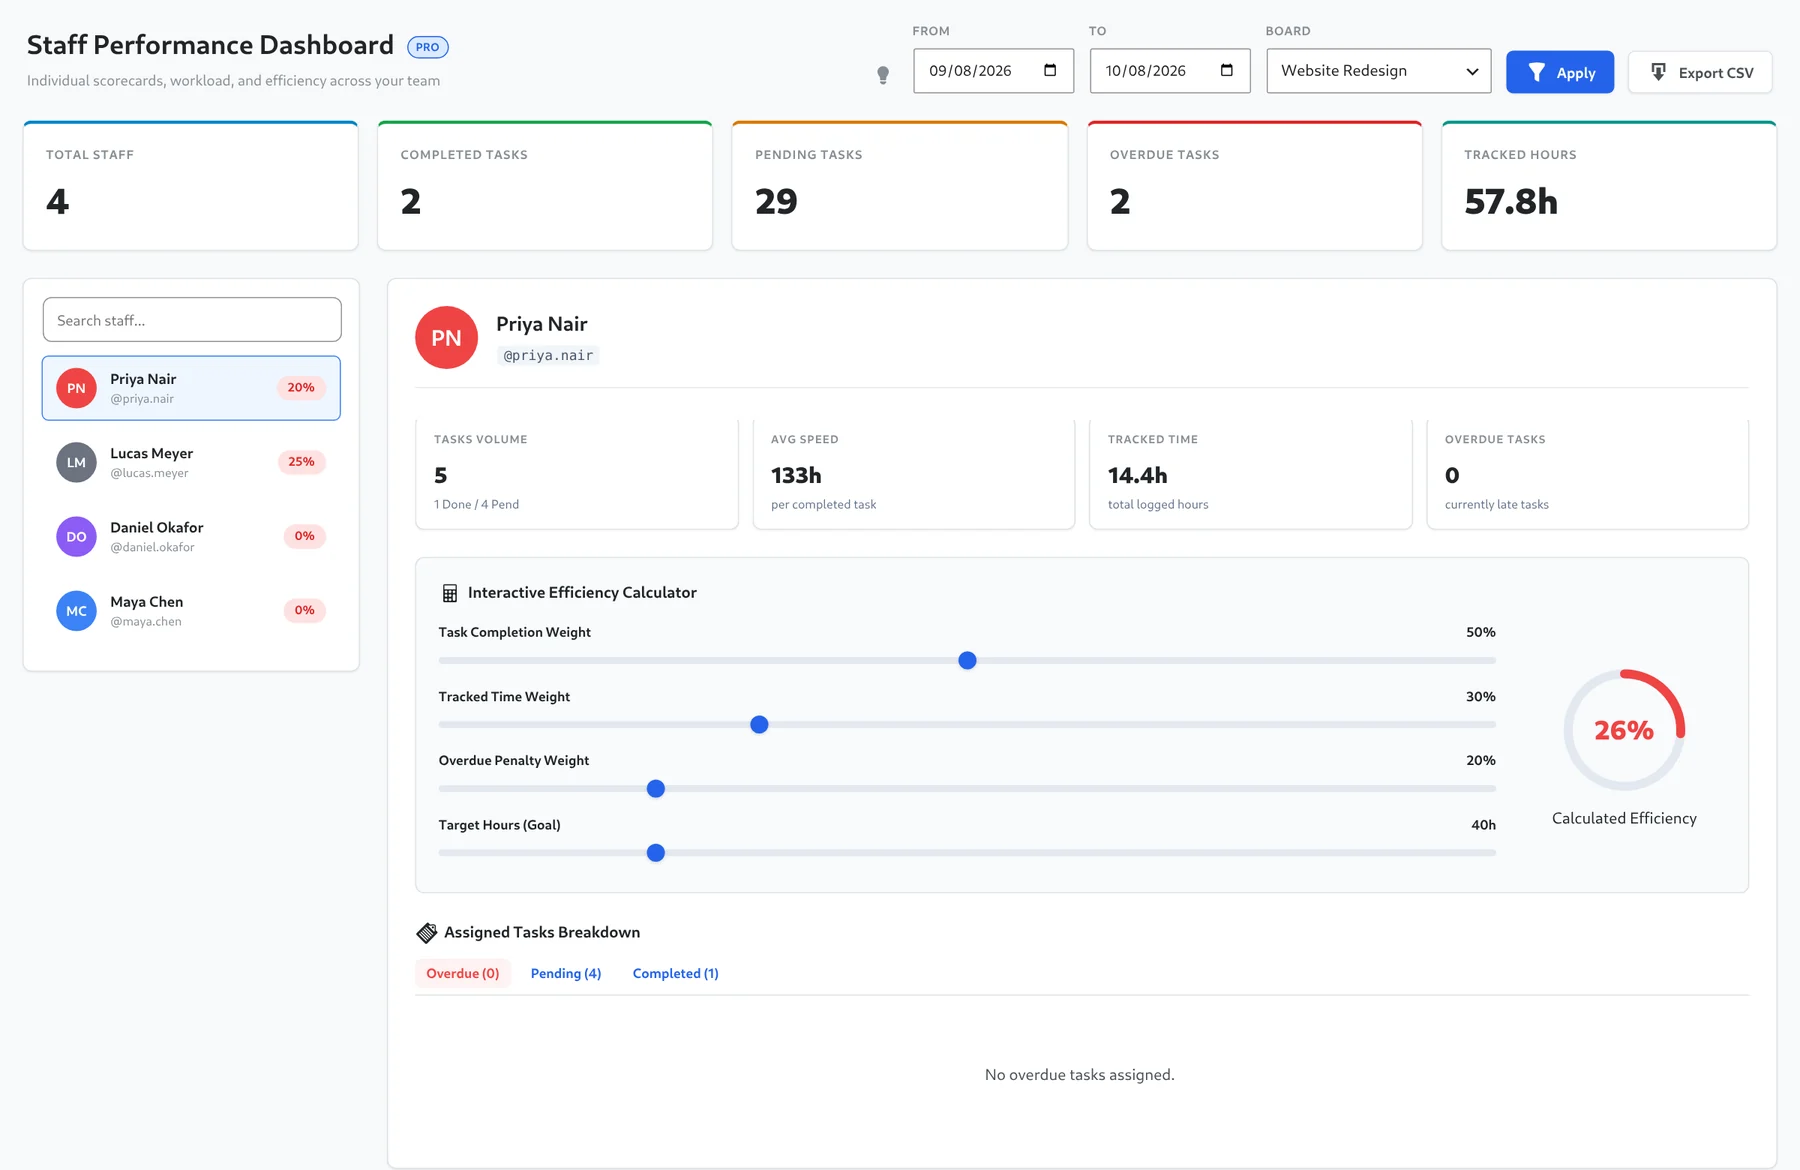
Filters and totals
- From / To dates and a Board filter, then Apply.
- Cards: Total Staff, Completed Tasks, Pending Tasks, Overdue Tasks and Tracked Hours.
- A chart of Completed Tasks per Staff (Top 10 Performers).
The scorecard
Pick a person from the list on the left. Each person shows a completion percentage badge. The scorecard shows:
- Tasks Volume: total, with done and pending counts.
- Avg Speed: hours per completed task.
- Tracked Time: total logged hours from Time Tracking.
- Overdue Tasks: currently late tasks.
- Assigned Tasks Breakdown: tabs for Overdue, Pending and Completed tasks.
Interactive efficiency calculator
Use the sliders to weight what matters to your team. The score updates instantly.
| Slider | Default | Effect |
|---|---|---|
| Task Completion Weight | 50% | How much the completion rate counts. |
| Tracked Time Weight | 30% | How much tracked hours count. |
| Overdue Penalty Weight | 20% | How hard overdue work is penalised. |
| Target Hours (Goal) | 40h | The tracked hours that count as a full score. |
time score = min(tracked hours / target hours, 1) x 100
base       = (completion rate x completion weight + time score x time weight)
             / (completion weight + time weight)
penalty    = overdue tasks / total tasks x penalty weight
score      = clamp(base - penalty, 0, 100)
The ring turns green at 75% or more, amber from 45%, and red below that. Your slider settings are saved in your browser.
Use scores as a conversation starter, not a verdict. They only know about what is recorded in Kanbanz.